Poleward shifting of storm tracks and its impact on wind resource in Patagonia
Shifting Winds: The Changing Storm Tracks and Their Impact on Patagonia’s Wind Energy Potential
The Patagonia region of South America is located in the mid-latitudes of the Southern Hemisphere. There, between 40ºS and 50ºS, winds normally blow from the west and are known as the westerlies. In the sailing world, this band of winds is also known as the "Roaring Forties" and has long been used by sailors to circumnavigate the globe. As there is almost no land over this band of latitudes, the "Roaring Forties" are not slowed down by land friction.
In addition, the band located approximately between 40ºS and 60ºS is known as the Southern Hemisphere Storm Track. Its name comes from the mid-latitude low-pressure systems that originate there due to the meridional temperature gradient, and the upper-level jet stream, which provides the vorticity necessary for the formation of storms.
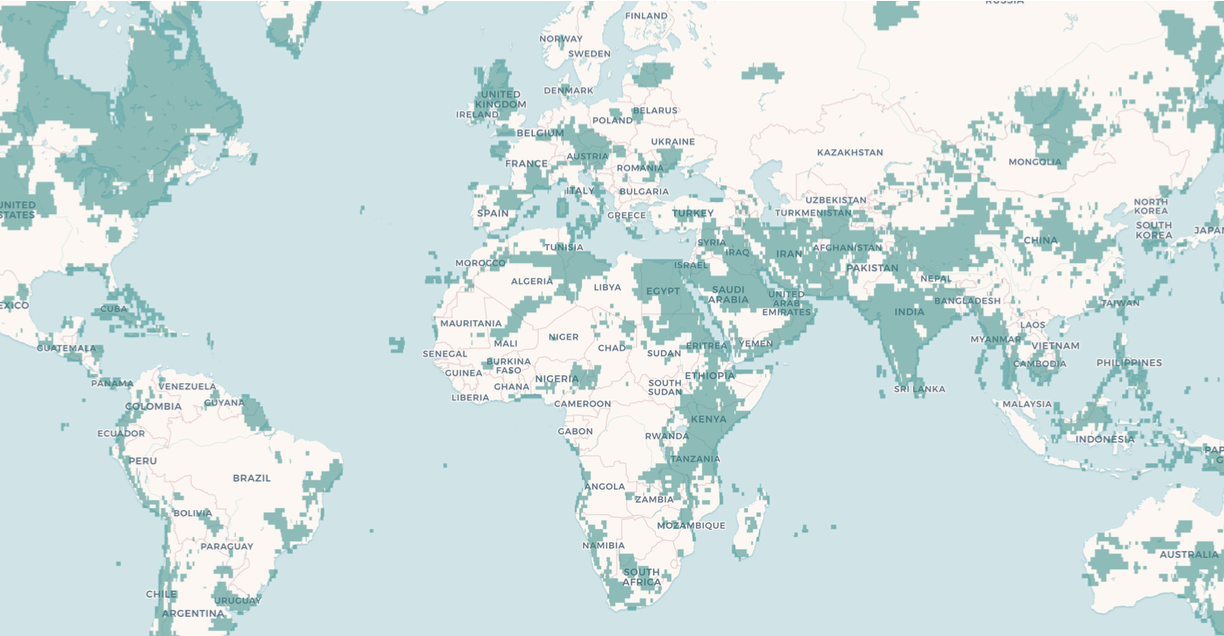
These winds make Patagonia an area of high wind potential (as shown in the Global Wind Atlas). However, climate change is expected to alter these patterns.
Bender et al. (2012) found observational evidence that the storm tracks have already shifted poleward in the recent decades (1983-2008). Using satellite cloud data as a proxy for storm tracks, they found that this band of maximum cloudiness became narrower and shifted poleward between 1983 and 2008.
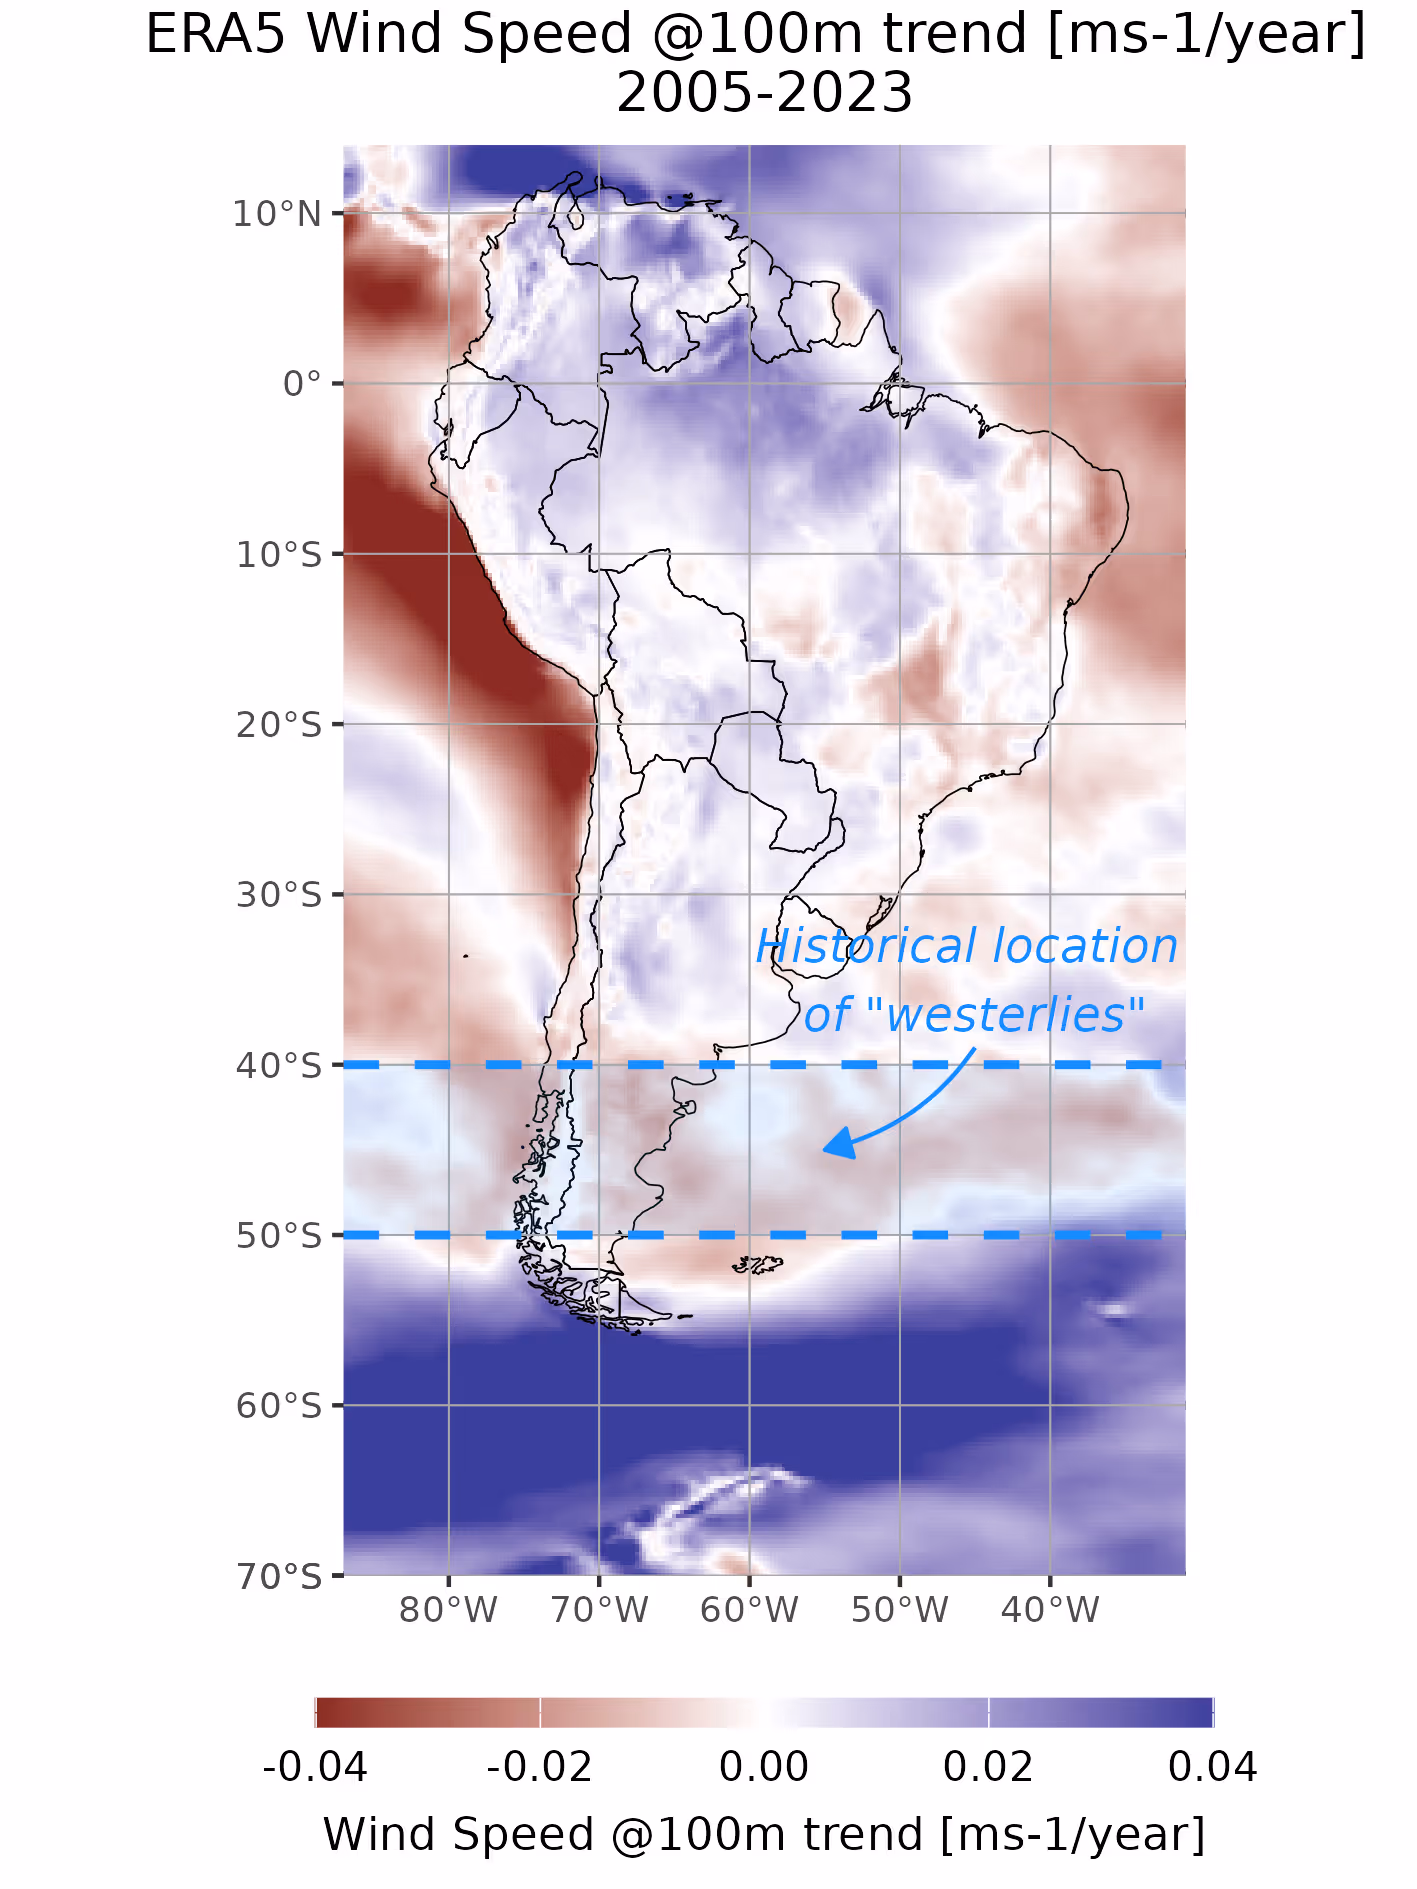
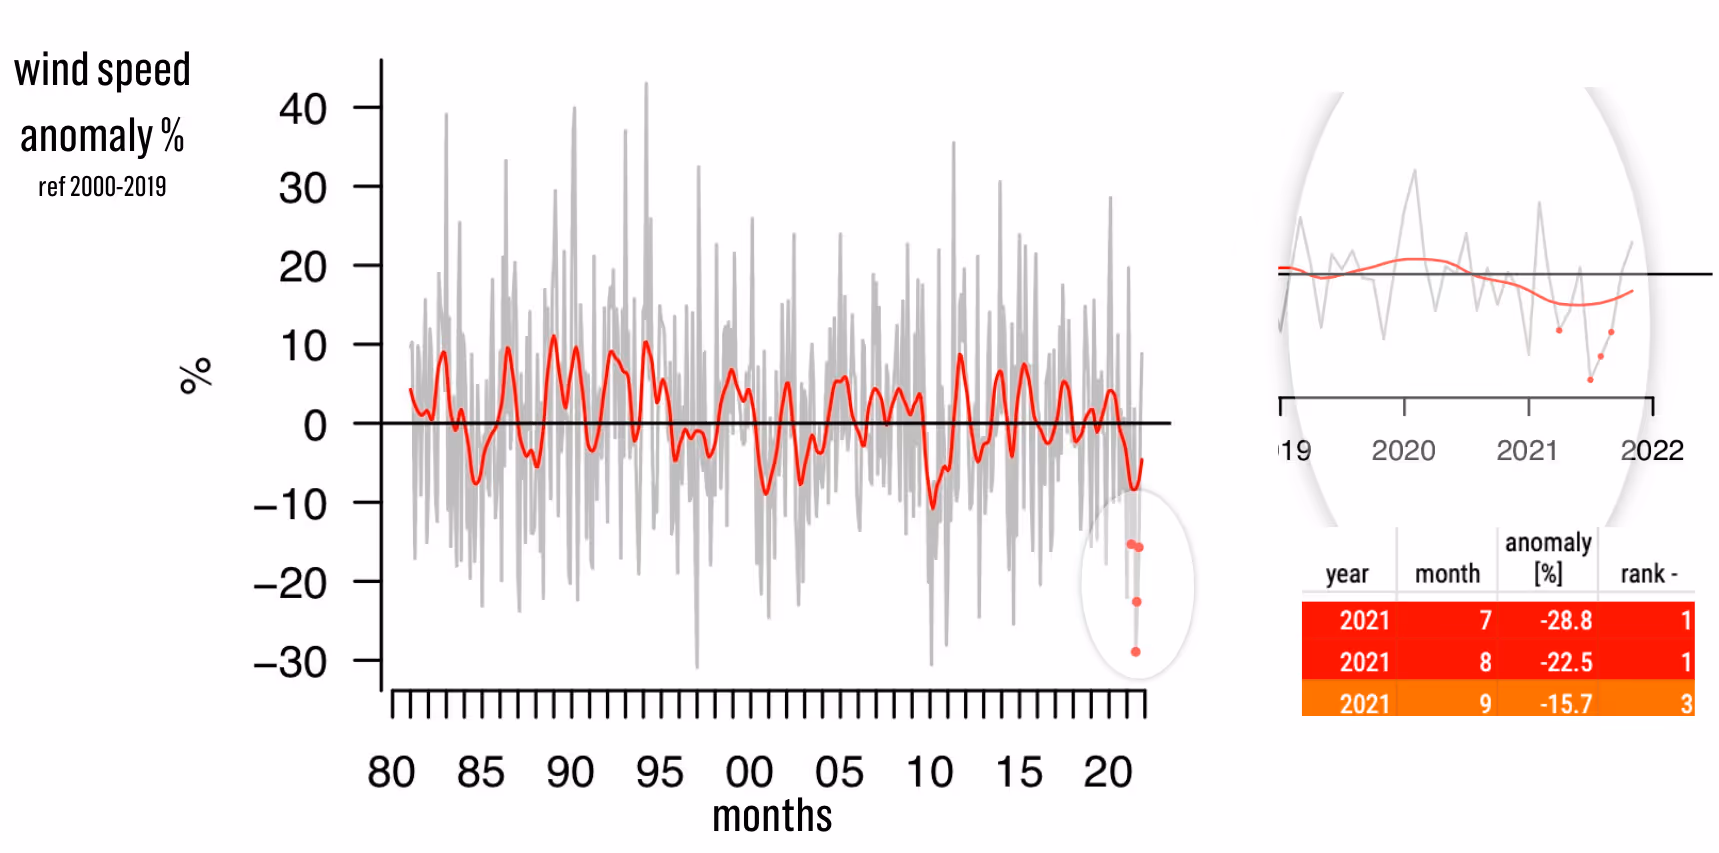
We have analysed the historical data, including the most recent period 2005-2023 (see Figure 1), and found that the trend of wind speed at 100 m height shows a similar pattern to that described by Reboita et al. (2018). There is a band of decreasing wind speed between 40-50ºS and another band of increasing wind speed south of 50ºS. This is consistent with the idea that the storm tracks, normally located between 40-50ºS, are moving southwards in the Southern Hemisphere.
In terms of the impacts of climate change on wind resource in the region, several studies have found that storm tracksare projected to shift poleward in a warmer climate, along with the intense westerly winds in Patagonia.
Reboita et al. (2018) study the wind intensity in the current and future climate over South America. Their findings suggest that, under climate change projections, storm tracks normally located between 40-50ºS are expected to move southwards. As a result, wind speeds are projected to decrease between 40ºS and 50ºS (central-northern Patagonia) while increasing south of 50ºS (southern Patagonia).
Similarly, Tamarin & Kaspi (2017) approached the study from a Lagrangian perspective, that is, following the trajectory of each individual storm. They found that in a warmer climate, cyclones tend to develop (on average) 1.3º poleward, and their mean track tilts more towards the pole.
Wind Resource Affected in Patagonia
Argentina has significant potential for wind energy development, especially in Patagonia, where winds are strong and consistent. In recent years, the country has increased its installed capacity, contributing to energy diversification and reducing greenhouse gas emissions. However, this growth faces challenges such as a lack of infrastructure for energy transmission and the need for financing new projects.
Most of Argentina's wind farms are located in Patagonia. The largest operational wind farm in terms of installed capacity is Puerto Madryn I with a capacity of 220 MW. It began operating in December 2018 with 62 Vestas V126 wind turbines of 3.6 MW each and belongs to the company Genneia, which owns the majority of wind farms in Argentina.
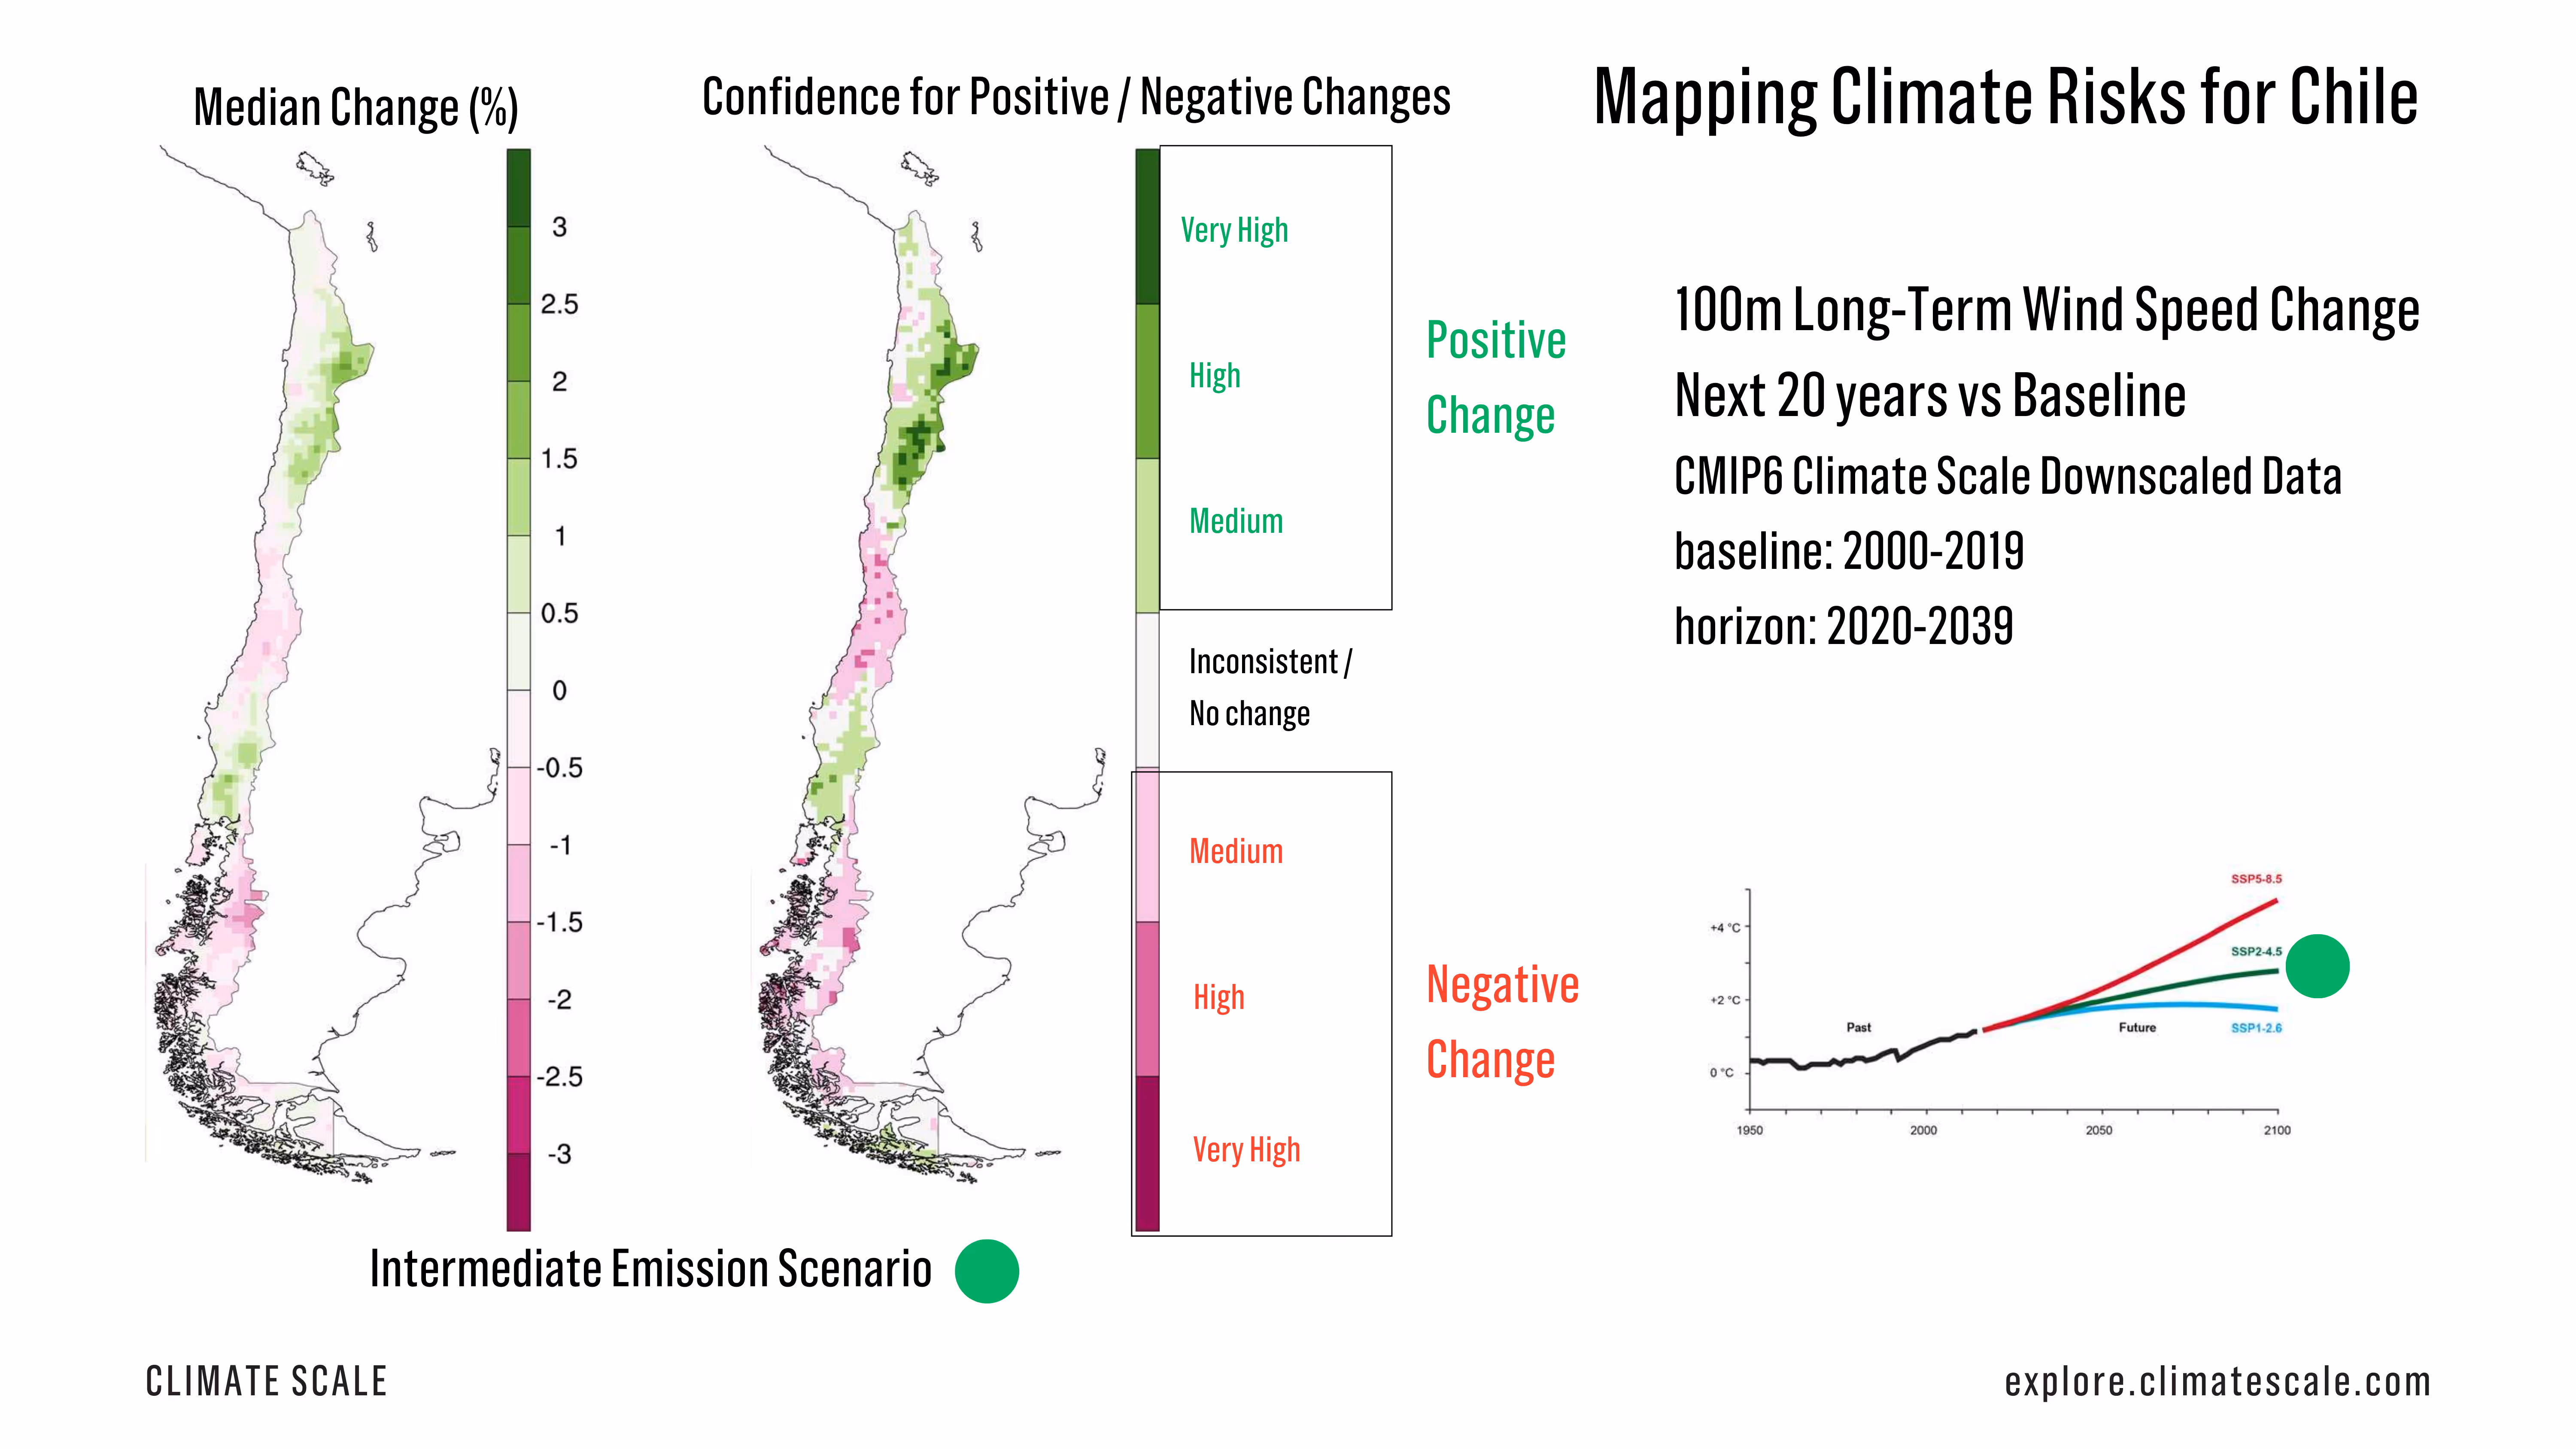
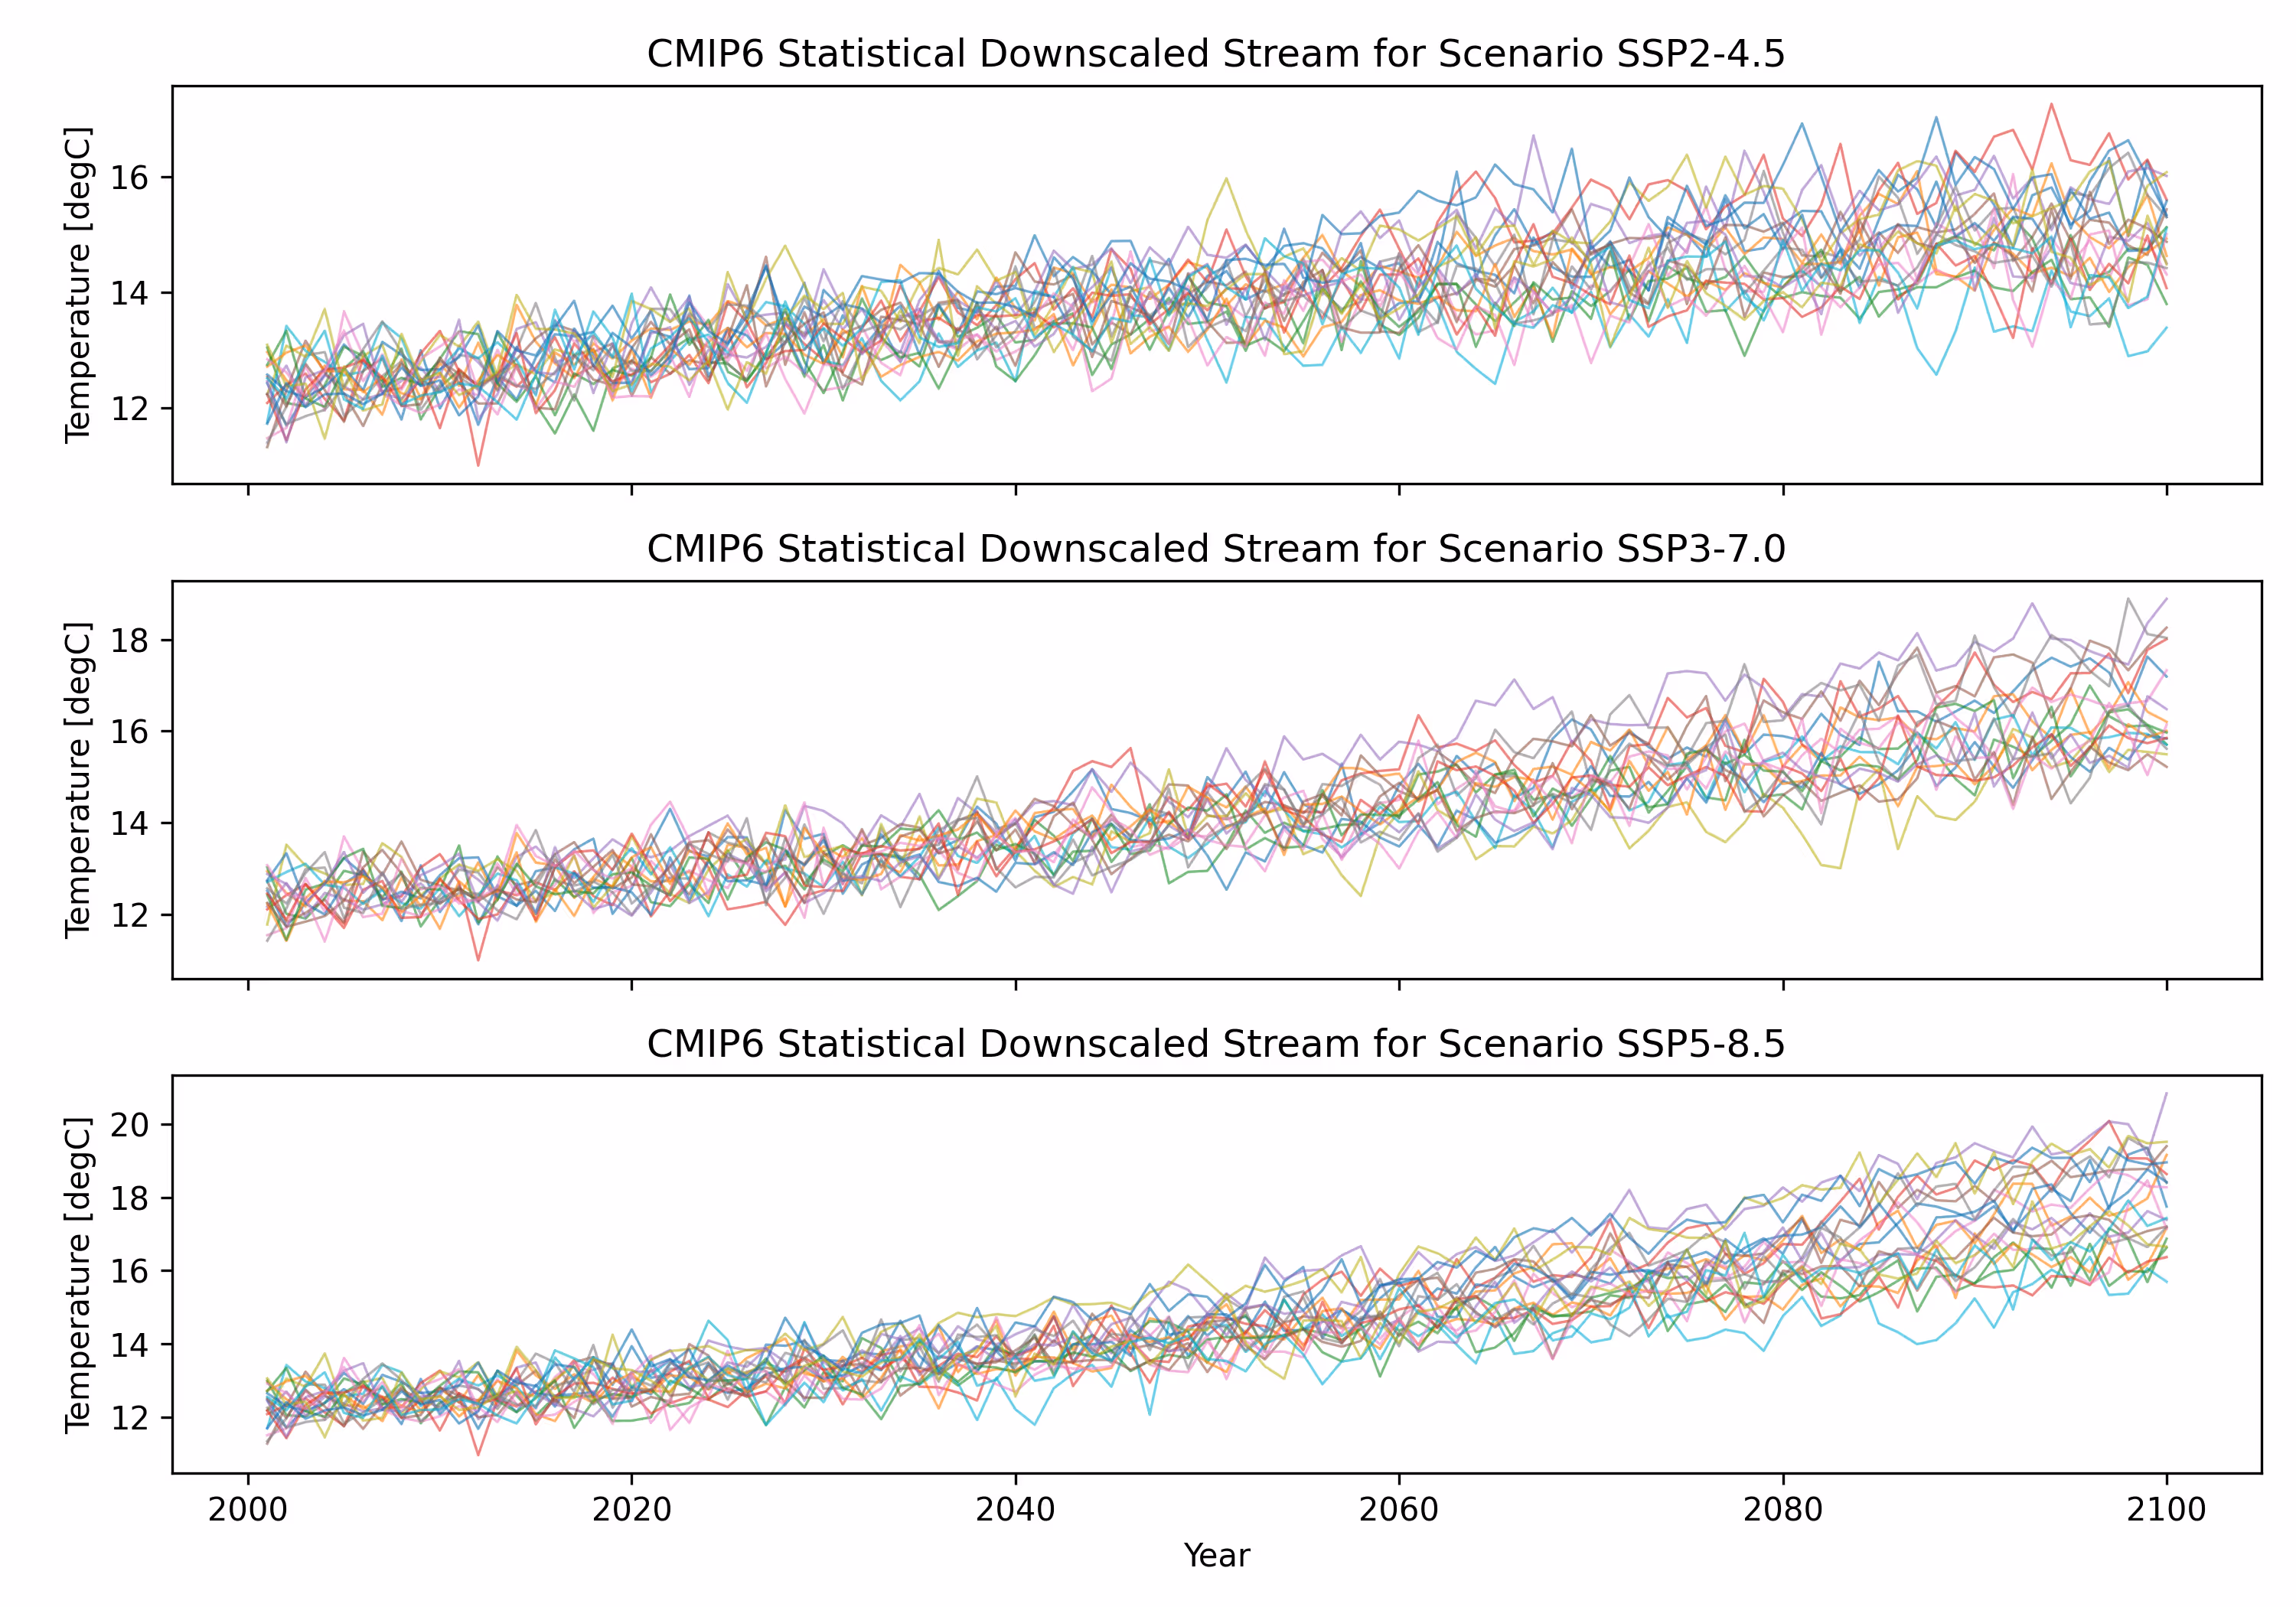
Puerto Madryn I is located at (42° 36' 32.6" S; 65° 14' 47.2" W), within the Southern Hemisphere Storm Tracks. Using Climate Scale's SERIES product at this location, Figure 2 shows a clear negative trend in the annual mean Wind Speed at 100 m, which is larger for the high-emission scenarios. This finding aligns with the conclusions of Reboita et al. (2018) and Tamarin & Kaspi (2017). The projected changes (w.r.t 2000-2019) for Puerto Madryn I over the period 2060-2079 are -1.1% (likely range between -2.6 and 0%) under a medium emissions scenario (SSP2-4.5) and -1.4% (likely range between -3 and -0.6%) under a high emissions scenario (SSP5-8.5).
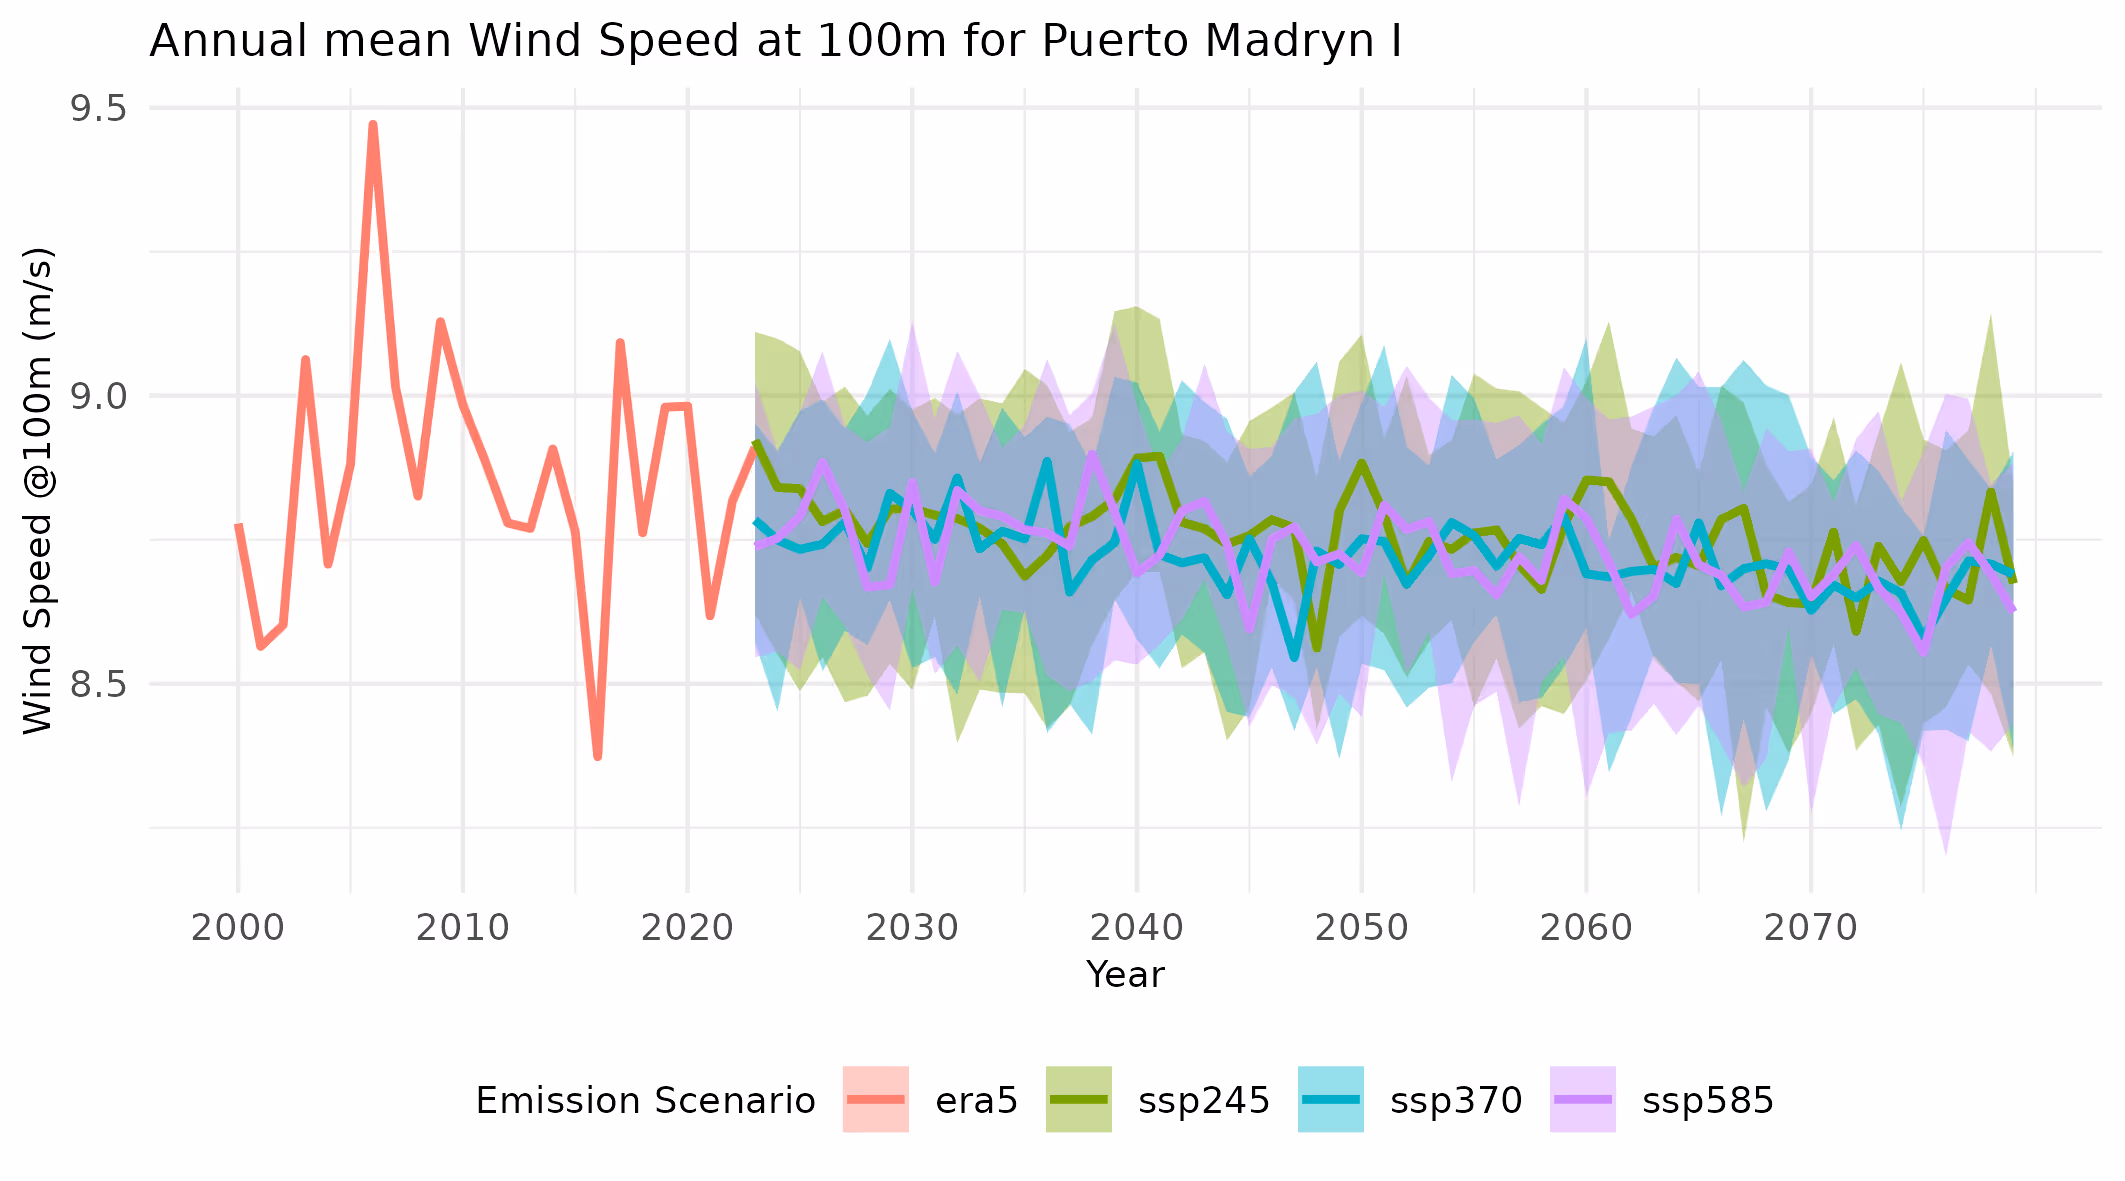
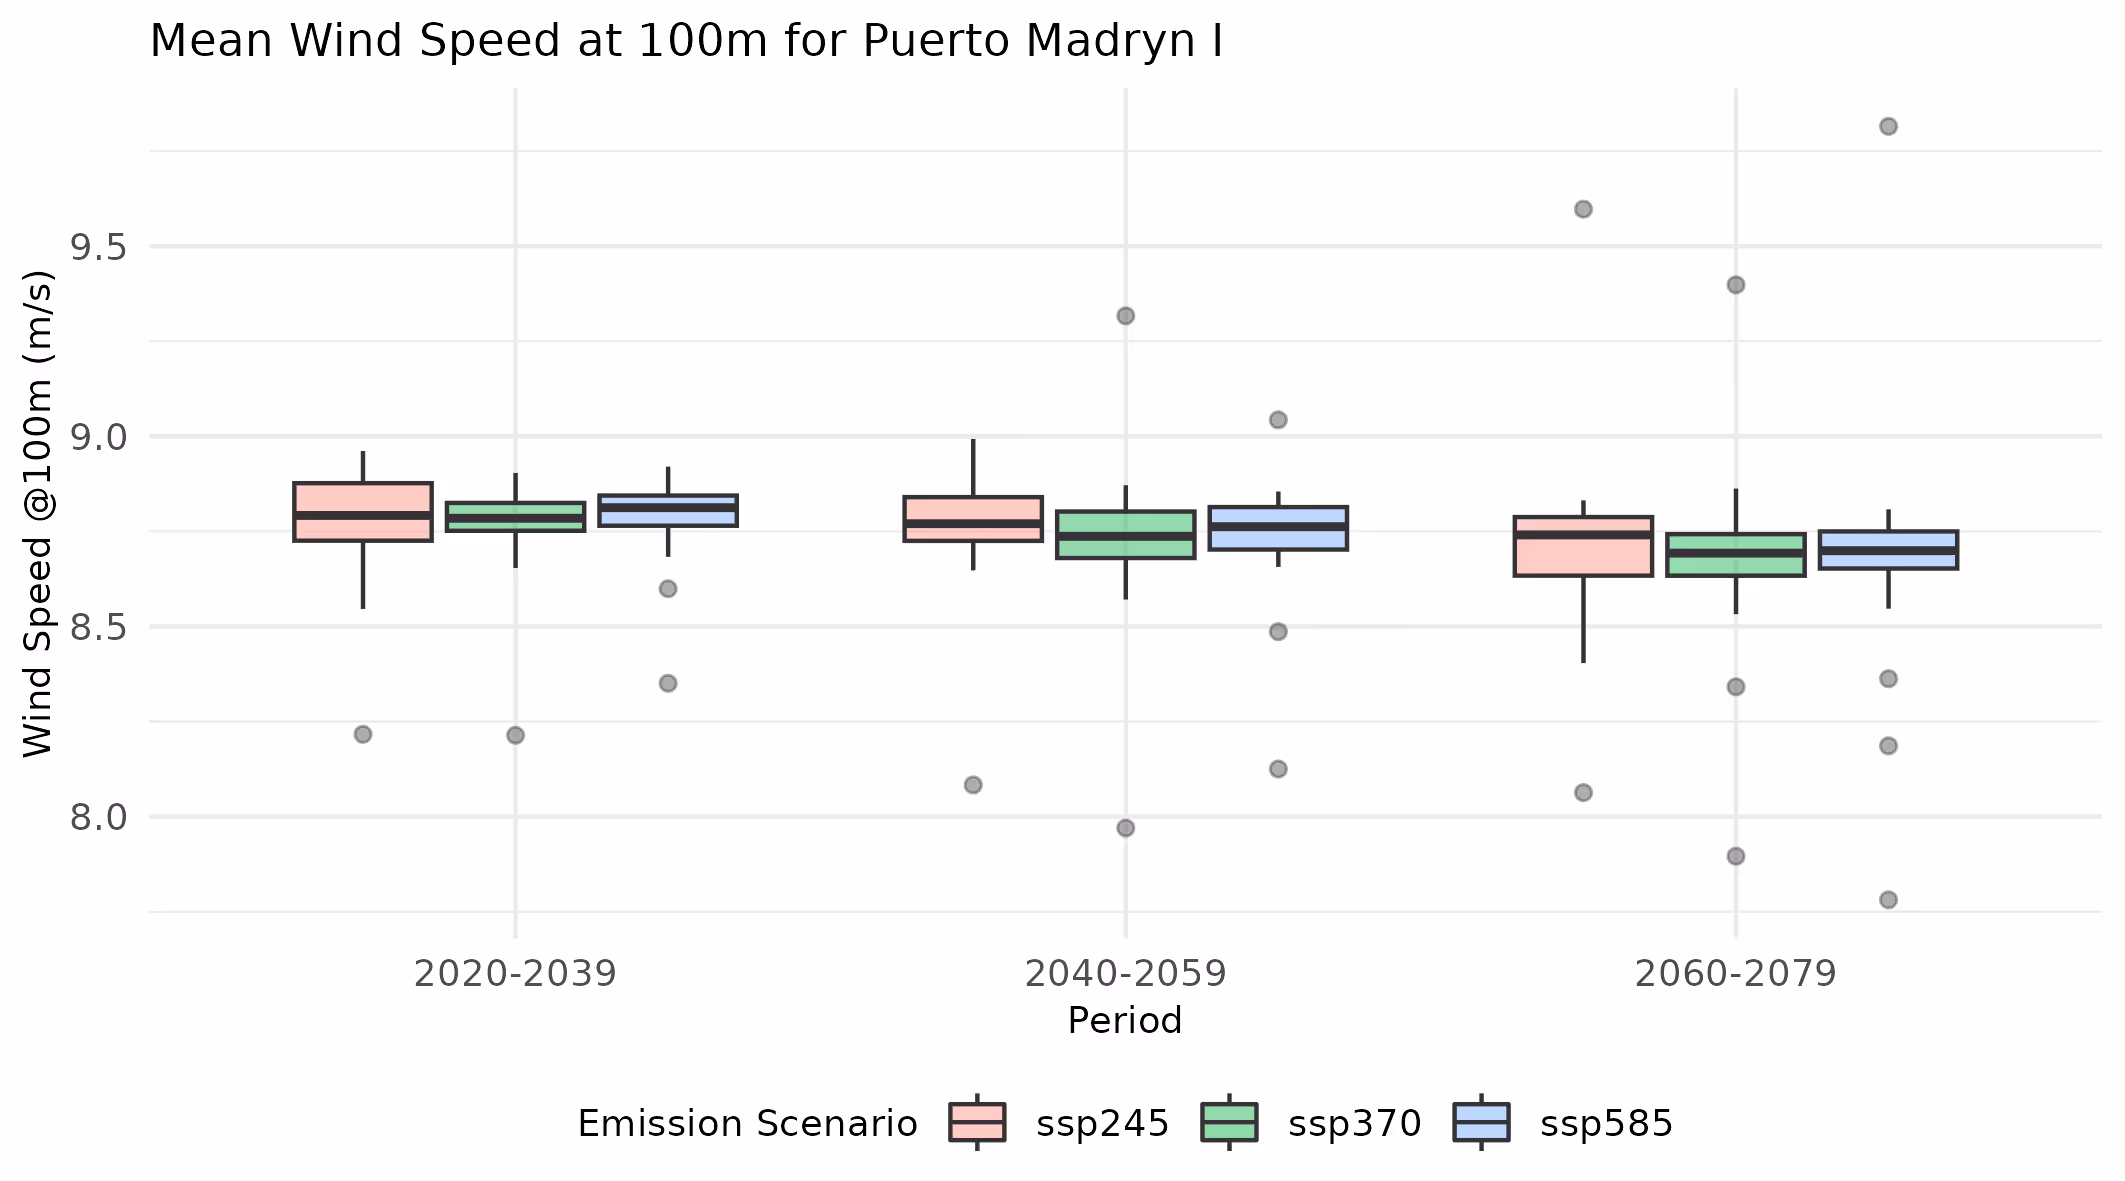
The annual mean wind speed at 100 m is decreasing and projected to decrease up to 3% (w.r.t. 2000-2019 and in the worst-case scenario). For a 3% decrease in wind speed, a rough approximation of the expected energy production loss is 4.5% (multiply wind speed change by 1.5). These estimates are based on simple assumptions about the relationship between wind speeds and production. A more detailed analysis using specific power curves to accurately estimate changes in production must be carried out to better estimate the potential impacts of climate change on the economics of the projects.
References
Bender, F. A., Ramanathan, V., & Tselioudis, G. (2012). Changes in extratropical storm track cloudiness 1983–2008: Observational support for a poleward shift. Climate Dynamics, 38, 2037-2053.
Reboita, M. S., Amaro, T. R., & de Souza, M. R. (2018). Winds: intensity and power density simulated by RegCM4 over South America in present and future climate. Climate Dynamics, 51, 187-205.
Tamarin, T., & Kaspi, Y. (2017). The poleward shift of storm tracks under global warming: A Lagrangian perspective. Geophysical Research Letters, 44(20), 10-666.
Share the word


.avif)